52 Week High Breakout Strategy – A Simple Guide for Beginners
Strong stocks often become stronger. Let's understand this powerful momentum strategy in very simple words, with real examples and easy steps.
What is a 52-Week High? (Simple Meaning)
Imagine you are looking at a stock's price for the last one full year. The highest price that stock reached during this entire year is called its 52-week high.
Suppose a stock moved between ₹200 and ₹500 in the last 12 months. Then ₹500 is its 52-week high. It's like the stock's own record high for the year.
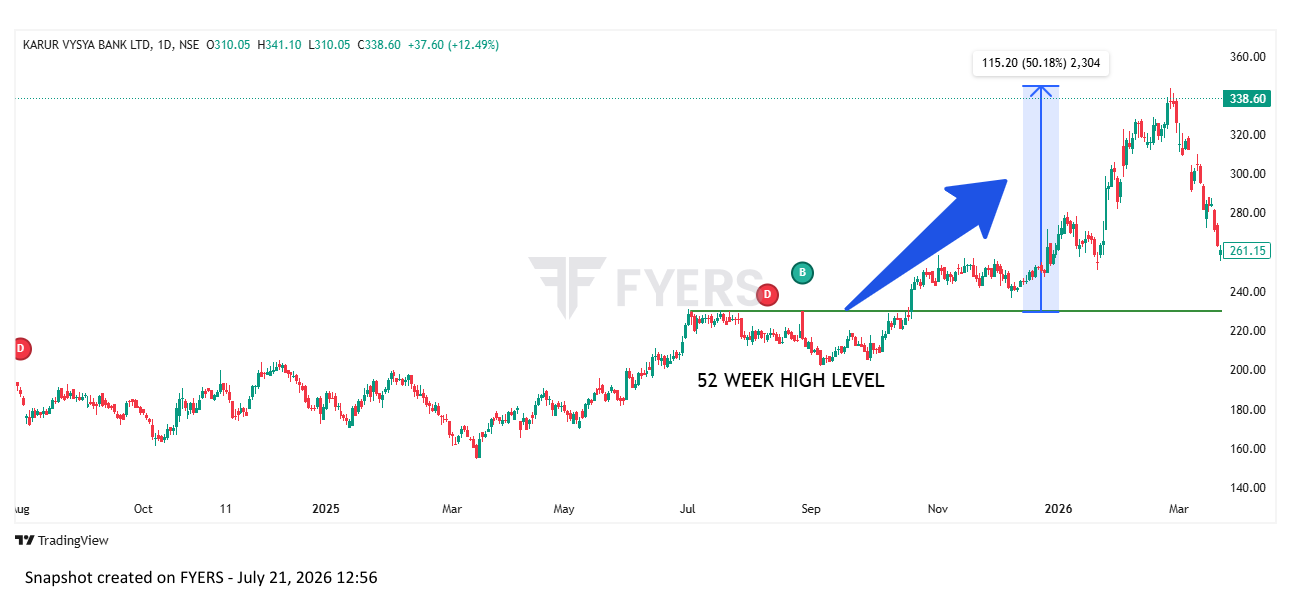 📈 Stock price touching ₹344.70 – the 52-week high line
So What is a 52-Week High Breakout?
A breakout happens when the stock not only touches its old highest price, but crosses above it and closes above that level. This is a big deal because it shows that buyers are now willing to pay even more than the previous record price.
Why Does This Happen? (The Human Psychology)
Stock market is not just about numbers. It's about how people feel and react. Let's understand the simple chain reaction that pushes the stock higher after a breakout.
They already bought at lower prices and are in profit. So they don't want to sell quickly. Less selling means less supply.
When they see a stock making new highs, they feel that something good is happening in the company. They also want to participate.
Mutual funds and big investors notice the strong trend. They start buying in large quantities, which pushes the price even higher.
Fear Of Missing Out. More and more traders see the price rising and jump in so they don't get left behind. This creates even more demand.
How to Confirm a Real Breakout? (Don't Get Trapped)
Sometimes a stock will cross the 52-week high and then immediately fall back down. This is called a false breakout. To avoid this trap, we look for confirmation from a few simple tools.
📊 Volume (Most Important)
Volume means how many shares were traded that day. On the day of breakout, the volume should be much higher than normal days. Think of it like this: if a rocket has to break Earth's gravity, it needs extra fuel. High volume is that extra fuel.
📈 RSI Indicator
RSI is a meter that shows if the stock is overbought or oversold. For a good breakout, we want RSI between 60 and 75. This means the stock is strong but not yet overheated. If RSI is above 85, the stock has already run up too much and might rest or fall.
Real Indian Stock Examples (For Learning Only)
Here are some well-known Indian companies that have shown 52-week high breakouts in the past. This is for learning only, not a buy recommendation.
📚 Educational purpose only · Not investment advice
How to Actually Trade This? (Simple 8-Step Plan)
You don't need to be a technical expert. Just follow these simple steps. Think of this as your cooking recipe for a breakout trade.
1. Look at the daily chart, not 5-minute chart.
2. Draw a horizontal line at the 52-week high price.
3. Wait. Let the price close above that line.
4. Check if the breakout candle is strong (big green body).
5. See the volume. It should be visibly higher than previous days.
6. Enter the trade near the closing price of the breakout day.
7. Put your stop loss just below the breakout level. This is your safety net.
8. Don't set a fixed target. Let the profit run and use a trailing stop loss.
Events That Often Cause Breakouts
Breakouts don't happen randomly. They are often triggered by specific events. If you know these events, you can be prepared.
Your Simple Pre-Trade Checklist
Before you take any trade, ask yourself these 7 questions.
☐ Did the price close above 52-week high?
☐ Was the breakout candle strong (not tiny)?
☐ Was the volume higher than average?
☐ Is the overall market (Nifty/Sensex) also strong?
☐ Did you set a stop loss?
☐ Are you comfortable with the risk?
☐ Are you buying near the breakout, not after a 5% run-up?
Tip: Even 5/7 is good. Never trade below 4/7.
Common Mistakes and How to Avoid Them
Every beginner makes these mistakes. Learn from them before you risk real money.
❌ Buying without checking volume
Volume is proof. Without it, it's just a fake move.
❌ Trading penny stocks
Cheap stocks get manipulated. Stick to quality names.
❌ Not placing a stop loss
Always know your max loss before entering.
❌ Overtrading
Don't trade every breakout. Wait for the best ones.
Risk Management – Protect Your Money
Trading is not about one big win. It's about protecting your money so you can trade tomorrow. Never risk too much on one idea. Even the best strategy fails sometimes.
Is This Strategy For You?
✔️ Beginners – Rules are simple and clear
✔️ Swing Traders – Hold for a few days to weeks
✔️ Positional Investors – Use to find strong long-term stocks
❌ Intraday Scalpers – Not for very short-term trades
Final Words from WealthGainer
The 52-week high breakout is a trusted strategy. It works best with patience. Learn, practice on paper first, and build confidence slowly.
Want to Know More? (Advanced Tips)
Watch FII/DII activity. If they are buying, the breakout is stronger. Also, use VWAP – if the stock stays above it post-breakout, it's a great sign.
🔗 Use Screeners for 52-Week Breakout
📖 Read Blog: Mutual Fund